用 Python 視覺化知識圖譜:別再跟「毛線球」搏鬥
文章資訊
作者:Juan Pablo Manson 日期:2026-06-21
原文標題:Visualizing Knowledge Graphs with Python: Stop Fighting With Hairballs
📝 重點摘要
TL;DR
GrafitoDB 用一行程式碼把雜亂圖譜接上既有工具,產出可讀、出版級的視覺化。
核心問題
傳統圖譜視覺化常以 force-directed 佈局收場,結果是標籤重疊、群集難辨的「毛線球」。多數圖資料庫只丟出 JSON 讓使用者自行摸索 47 個 JS 函式庫。GrafitoDB 不重造輪子,而是提供乾淨的橋接層,把圖匯出到 NetworkX 後接上 PyVis、Cytoscape.js、Netgraph 等成熟工具。
關鍵發現 / 數據
- 從記憶體中的圖到可用視覺化,最少僅需「一個函式呼叫」,零摩擦。
- Netgraph 的
edge_layout='curved'用樣條曲線繞過節點,邊不會橫切無關圓圈;節點永遠繪於邊之上。 - PyVis 的
spreadphysics preset 適合主題鬆散的知識圖;輸出為自含 HTML,可拖曳互動。 - Cytoscape.js 的
cose(compound spring embedder) 佈局對密集圖比純 force-directed 更易讀。 - 支援多後端:Netgraph、PyVis、Cytoscape、D3、Graphviz、Mermaid、Matplotlib。
方法亮點
- 統一以 NetworkX 為中介格式,再分派到各視覺化後端。
- 提供
color_by_label、自訂label_fn、color_map等高層參數,降低設定負擔。 - 同時支援 Cypher 查詢(
MATCH ... RETURN)。 - 場景化選型建議:探索用 PyVis、論文用 Netgraph(向量 SVG/PDF)、密集圖用 Cytoscape cose。
對我的研究有用嗎?
對 GraphRAG / LLM Graph 研究的價值偏「工具與工程」而非方法論。若你需要快速檢視 LLM 抽取出的知識圖、或在論文中放出版級圖示,GrafitoDB 的低摩擦匯出與 Netgraph 曲線繞節點技巧值得借用。但它不涉及圖建構、檢索或評估等核心研究議題。
評語
品質為清楚的工具推廣文,實用但偏行銷;無 benchmark 或量化比較,深讀價值低,當作工具書籤即可。
🌐 中英對照
Author: Juan Pablo Manson
Published:
Source: https://medium.com/@juanpablomanson/visualizing-knowledge-graphs-with-python-stop-fighting-with-hairballs-760324fbf717
Fetched: 2026-06-21T11:13:05.554172作者:Juan Pablo Manson
發布日期:
來源:https://medium.com/@juanpablomanson/visualizing-knowledge-graphs-with-python-stop-fighting-with-hairballs-760324fbf717
擷取時間:2026-06-21T11:13:05.554172
Visualizing Knowledge Graphs with Python: Stop Fighting With Hairballs / 用 Python 視覺化知識圖譜:別再跟「毛球」搏鬥了
How GrafitoDB turns messy graphs into actually readable, publication-quality visuals — with almost no effort.
*GrafitoDB* 如何幾乎毫不費力地,把雜亂的圖譜轉化為真正易讀、達到出版品質的視覺化作品。
If you’ve ever tried to visualize a knowledge graph, you know the pain. You run a force-directed layout and end up with what looks like a ball of yarn after a cat got to it. Labels overlap, clusters are impossible to distinguish, and you spend more time fighting the visualization library than actually understanding your data.
如果你曾嘗試視覺化一個知識圖譜 (Knowledge Graph),你一定懂那種痛苦。你跑了一次力導向佈局 (force-directed layout),結果得到的東西看起來就像被貓玩過的一團毛線。標籤互相重疊、群集 (cluster) 根本無法區分,而你花在跟視覺化函式庫搏鬥上的時間,遠多於真正理解資料的時間。
GrafitoDB takes a different approach. Instead of building yet another visualization tool, it gives you clean, well-designed bridges to tools that already do this extremely well: PyVis, Cytoscape.js, and especially Netgraph.
GrafitoDB 採取了不同的做法。它不是再去打造另一個視覺化工具,而是為你提供乾淨、設計良好的橋接,連接到那些早已把這件事做得非常出色的工具:PyVis、Cytoscape.js,尤其是 Netgraph。
The result is that you can go from a graph in memory to something genuinely useful in a few lines of code.
結果就是,你可以用短短幾行程式碼,從記憶體中的一張圖譜,得到真正實用的成果。
A Minimal Example / 一個最小範例
Here is the smallest possible example that creates a knowledge graph and visualizes it:
以下是建立知識圖譜並將其視覺化的最小可能範例:
from grafito import GrafitoDatabase
from grafito.integrations import export_graph
db = GrafitoDatabase(":memory:")

# Create nodes
alice = db.create_node(labels=["Person"], properties={"name": "Alice"})
bob = db.create_node(labels=["Person"], properties={"name": "Bob"})
kg = db.create_node(labels=["Topic"], properties={"name": "Knowledge Graphs"})

# Create relationships
db.create_relationship(alice.id, kg.id, "RESEARCHES")
db.create_relationship(bob.id, kg.id, "USES")

# Export and visualize
graph = db.to_networkx()
export_graph(graph, "graph.png", backend="netgraph", node_label="name")

# GrafitoDB also supports Cypher queries!:
# results = db.query("MATCH (p:Person)-[r]->(t) RETURN p.name, type(r), t.name")
This produces a clean visualization of the graph. The rest of this article explores the different visualization options available in GrafitoDB.
這會產生一張乾淨的圖譜視覺化。本文接下來的部分,將探討 GrafitoDB 中可用的各種視覺化選項。
The Core Problem With Most Graph Visualizations / 大多數圖譜視覺化的核心問題
Most graph databases treat visualization as “export to JSON and good luck.” You get a blob of data and then have to figure out which of the 47 JavaScript libraries will make it look decent!
大多數圖資料庫 (graph database) 對待視覺化的態度是「匯出成 JSON,然後祝你好運。」你拿到一坨資料,接著得自己搞清楚 47 個 JavaScript 函式庫中,到底哪一個能讓它看起來像樣!
GrafitoDB does something simpler. It exports to NetworkX (the standard in Python) and then hands you properly implemented integrations with tools that care about aesthetics:
GrafitoDB 做了更簡單的事。它匯出到 NetworkX(Python 中的標準工具),然後交給你與那些注重美感的工具之間實作良好的整合:
- PyVis — Quick interactive views in the browser
- Cytoscape.js — Professional layouts when force-directed isn’t enough
-
Netgraph— Static images that actually look deliberate
-
PyVis — 在瀏覽器中快速產生互動式視圖
- Cytoscape.js — 當力導向佈局不夠用時,提供專業級的佈局
- Netgraph — 真正看起來經過精心設計的靜態圖片
Let’s look at what these actually produce with real data.
讓我們看看這些工具用真實資料實際產生的成果。
Netgraph: Publication-Quality Images Without the Suffering / Netgraph:無痛產生出版品質的圖片
This is where GrafitoDB shines. Netgraph combined with GrafitoDB’s export helpers produces figures that look like they were made by someone who actually cares about visual communication.
這正是 GrafitoDB 大放異彩之處。Netgraph 搭配 GrafitoDB 的匯出輔助工具,能產生看起來像是由真正在乎視覺溝通的人所製作的圖表。
Here’s a real example generated directly from a knowledge graph in GrafitoDB:
以下是直接從 GrafitoDB 中的知識圖譜產生的真實範例:
Press enter or click to view image in full size
按 Enter 或點擊以全尺寸檢視圖片
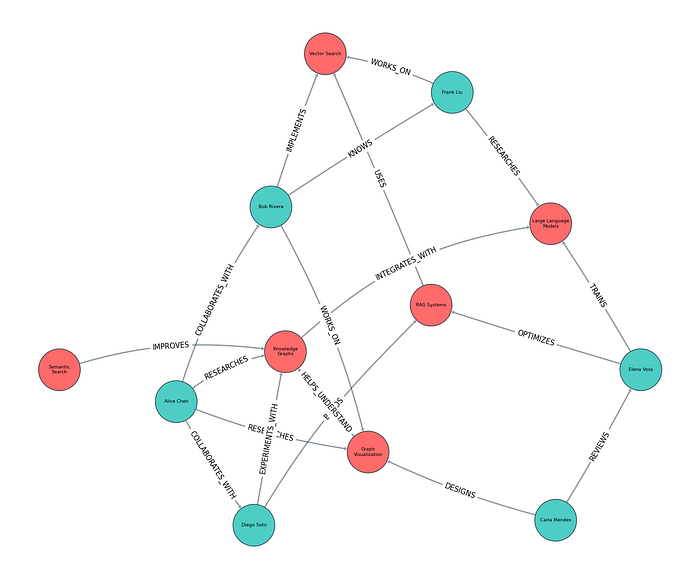
The code to generate this is almost embarrassingly simple:
產生這張圖的程式碼簡單到幾乎令人不好意思:
from grafito.integrations import export_graph

export_graph(
    graph,
    'knowledge-graph.png',
    backend='netgraph',
    node_label='name',
    color_by_label=True,
    node_size=9,
    edge_layout='curved',
)
What stands out is how little configuration you need for something that already looks reasonable. The one option worth knowing is edge_layout=’curved’: it routes each connection as a spline whose control points are optimized to bend around nodes, so edges never cut straight across an unrelated circle. Nodes are also always drawn on top of edges, so even when two circles end up close together the connection passes cleanly behind them instead of over them.
引人注目的是,要做出已經看起來相當合理的成果,你需要的設定竟然這麼少。唯一值得認識的選項是 edge_layout=’curved’:它會把每條連接繪製成一條樣條曲線 (spline),其控制點經過最佳化,使曲線繞過節點彎曲,因此邊線 (edge) 永遠不會直直地穿過一個不相關的圓圈。此外,節點 (node) 永遠繪製在邊線之上,所以即使兩個圓圈最後靠得很近,連接也會乾淨俐落地從它們後方穿過,而不是從上方蓋過去。
Here’s another useful technique: using a custom label function to show the node type above the name:
以下是另一個實用技巧:使用自訂標籤函式,在名稱上方顯示節點類型:
def label_with_wrap(node_id, attrs):
    labels = attrs.get("labels", [])
    name = attrs.get("properties", {}).get("name", str(node_id))
    return f"{labels[0]}\n{name}" if labels else name

export_graph(
    graph,
    "graph.png",
    backend="netgraph",
    label_fn=label_with_wrap,
    color_map={"Person": "#4ecdc4", "Topic": "#ff6b6b"},
    node_size=8,
    node_label_fontdict={"size": 12, "fontweight": "bold"},
)
Press enter or click to view image in full size
按 Enter 或點擊以全尺寸檢視圖片
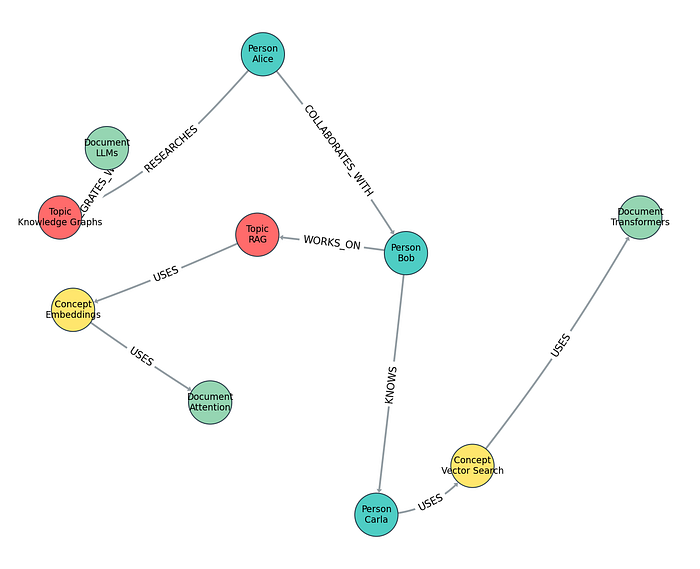
You can go much deeper if you want — custom label functions, edge labels, specific color palettes, matplotlib subplots with multiple layouts — but the defaults are already good.
如果你願意,可以深入鑽研更多——自訂標籤函式、邊線標籤、特定的調色盤、含多種佈局的 matplotlib 子圖 (subplot)——但其預設值就已經相當不錯了。
For even more advanced customization options, check the official visualization documentation.
若想了解更進階的自訂選項,請參閱官方視覺化文件。
PyVis: When You Need Something Interactive Fast / PyVis:當你需要快速取得互動式成果時
Sometimes you don’t want a static image. You want to explore the graph, drag nodes around, zoom in on clusters.
有時你要的不是一張靜態圖片。你想探索圖譜、拖曳節點、放大檢視群集。
PyVis is perfect for this. With GrafitoDB it’s a one-liner:
PyVis 正適合這個需求。搭配 GrafitoDB,只需一行程式碼:
from grafito.integrations import save_pyvis_html

save_pyvis_html(
    graph,
    path='knowledge-graph.html',
    node_label='name',
    color_by_label=True,
    physics='spread'
)
The result is a self-contained HTML file with physics simulation. You can open it in any browser, drag nodes, and actually explore the structure. The spread physics preset tends to work well for knowledge graphs where you want to see separation between topics.
結果是一個包含物理模擬的自包含 (self-contained) HTML 檔案。你可以在任何瀏覽器中開啟它、拖曳節點,並真正地探索其結構。當你想看到不同主題之間的區隔時,spread 物理預設值對知識圖譜往往效果很好。
Here’s what a well-tuned PyVis visualization looks like:
以下是一個經過良好調校的 PyVis 視覺化所呈現的樣子:
Press enter or click to view image in full size
按 Enter 或點擊以全尺寸檢視圖片
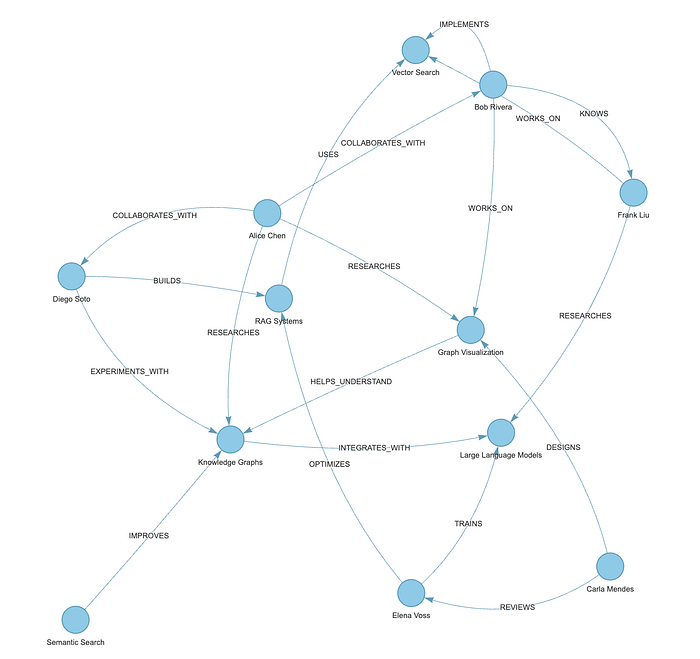
For sharing with stakeholders who aren’t technical, this is often the most effective option. They open a link and can actually interact with the data instead of staring at a screenshot.
對於要分享給非技術背景的利害關係人 (stakeholder) 來說,這往往是最有效的選擇。他們打開一個連結,就能真正地與資料互動,而不是盯著一張截圖看。
When Force-Directed Layouts Aren’t Enough / 當力導向佈局不夠用時
Not every graph benefits from force-directed layouts. Sometimes you have hierarchical data, or you want to emphasize certain relationships over others.
並非每張圖都能從力導向佈局中受益。有時你的資料是階層式 (hierarchical) 的,或者你想強調某些關係而非其他關係。
This is where Cytoscape.js shines. GrafitoDB supports exporting directly to it:
這正是 Cytoscape.js 大放異彩之處。GrafitoDB 支援直接匯出到它:
from grafito.integrations import export_graph

graph = db.to_networkx()

export_graph(graph, "graph.html", backend="cytoscape", node_label="label_and_name", layout="cose")
The cose layout (compound spring embedder) often produces more readable results for knowledge graphs than pure force-directed approaches. The output is a single HTML file with no external dependencies.
cose 佈局(複合彈簧嵌入器,compound spring embedder)對知識圖譜而言,往往能產生比純力導向方法更易讀的結果。其輸出是一個沒有外部相依套件的單一 HTML 檔案。
D3 is another option that produces a clean, self-contained HTML file:
D3 是另一個選擇,它能產生乾淨、自包含的 HTML 檔案:
from grafito.integrations import export_graph
graph = db.to_networkx()
export_graph(graph, "graph.html", backend="d3", node_label="label_and_name")
Other Backends / 其他後端
GrafitoDB also supports a few more visualization options that can be useful in specific cases:
GrafitoDB 還支援更多在特定情況下可能很有用的視覺化選項:
Graphviz / Graphviz
from grafito.integrations import export_graph
export_graph(graph, "graph.dot", backend="graphviz", node_label="name")
# Then render with: dot -Tpng graph.dot -o graph.png
Example output:
範例輸出:
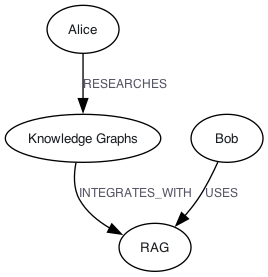
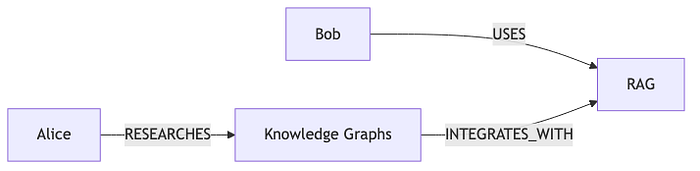
Mermaid / Mermaid
Mermaid is useful when you want diagrams that render directly in Markdown viewers (GitHub, GitLab, Obsidian, etc.):
當你想要能在 Markdown 檢視器(GitHub、GitLab、Obsidian 等)中直接渲染的圖表時,Mermaid 就很有用:
from grafito.integrations import export_graph

export_graph(graph, "graph.mmd", backend="mermaid", node_label="name")
Press enter or click to view image in full size
按 Enter 或點擊以全尺寸檢視圖片
Matplotlib / Matplotlib
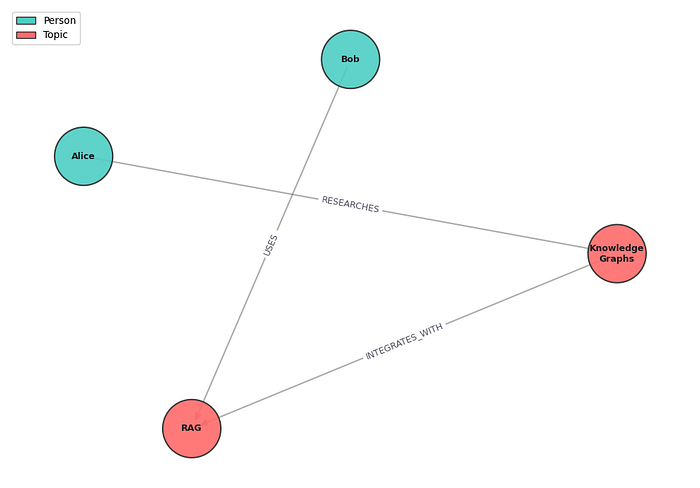
You can also use the classic Matplotlib backend for full control:
你也可以使用經典的 Matplotlib 後端,以取得完全的控制權:
from grafito.integrations import save_matplotlib

save_matplotlib(graph, "graph.png", node_label="name")
Press enter or click to view image in full size
按 Enter 或點擊以全尺寸檢視圖片
Choosing the Right Tool / 選擇合適的工具
After working with all of these, here’s the mental model I’ve settled on:
在使用過所有這些工具之後,以下是我最終歸納出的思維模型:
- Quick exploration → PyVis (Interactive HTML) — fast feedback loop
- Sharing with non-technical people → PyVis or Cytoscape (self-contained HTML) — no installation required
- Medium article or blog post → Netgraph (PNG + SVG) — looks deliberate
- Academic paper or report → Netgraph (PDF / high-res PNG) — publication quality
-
Dense, interconnected graphs → Cytoscape with cose (Interactive HTML) — better structure preservation
-
快速探索 → PyVis(互動式 HTML)— 回饋循環快速
- 分享給非技術人員 → PyVis 或 Cytoscape(自包含 HTML)— 無需安裝任何東西
- Medium 文章或部落格貼文 → Netgraph(PNG + SVG)— 看起來經過精心設計
- 學術論文或報告 → Netgraph(PDF/高解析度 PNG)— 出版品質
- 密集、高度互連的圖譜 → 搭配 cose 的 Cytoscape(互動式 HTML)— 更好地保留結構
The Real Advantage / 真正的優勢
What makes this approach powerful isn’t any single integration. It’s the lack of friction.
讓這種做法強大的,並不是任何單一的整合,而是它的「零摩擦」。
You have a graph in GrafitoDB. You want to see it. You call one function. You get something worth looking at.
你在 GrafitoDB 裡有一張圖。你想看看它。你呼叫一個函式。你就得到了值得一看的成果。
You don’t need to:
你不需要:
- Learn D3.js
- Configure a React component
- Write custom JavaScript for layout
-
Deal with CORS or hosting issues for interactive views
-
學習 D3.js
- 設定一個 React 元件
- 為佈局撰寫自訂的 JavaScript
- 為互動式視圖處理 CORS 或主機託管問題
The library handles the translation work. You stay in Python with your data.
這個函式庫會處理好轉換的工作。你只需待在 Python 中,守著你的資料。
That difference matters. Most knowledge graphs never get properly visualized because the process is painful enough that people put it off. When the cost of visualization drops to nearly zero, you start using it as part of your thinking process instead of as a final presentation step.
這個差異很關鍵。大多數知識圖譜從未被妥善地視覺化,因為這個過程痛苦到讓人一拖再拖。當視覺化的成本降到趨近於零時,你會開始把它當作思考過程的一部分,而不僅僅是最後的呈現步驟。
Practical Tips for Better Results / 取得更佳成果的實用技巧
A few things that help with knowledge graphs specifically:
以下是幾項特別有助於知識圖譜的訣竅:
-
Use color_by_label=True — Different node types (Person vs Topic vs Document) become immediately distinguishable.
-
使用 color_by_label=True — 不同的節點類型(Person、Topic、Document)會立刻變得可以區分。
-
Be deliberate with physics presets — compact works better for dense clusters.
spreadhelps when you have many loosely connected topics. -
謹慎選用物理預設值 — compact 對密集的群集效果較好;當你有許多鬆散連接的主題時,
spread則更有幫助。 -
Consider custom label functions — Sometimes showing type + name on two lines is more readable than just the name.
-
考慮使用自訂標籤函式 — 有時把「類型 + 名稱」分成兩行顯示,會比只顯示名稱更易讀。
-
Don’t underestimate Netgraph for articles — The vector output (SVG) looks crisp at any size and works beautifully in Medium.
-
別低估 Netgraph 用於文章的價值 — 其向量輸出 (SVG) 在任何尺寸下都清晰銳利,並且在 Medium 上呈現得非常漂亮。
Final Thoughts / 結語
GrafitoDB doesn’t try to be a visualization framework. It just removes the annoying parts of using the good ones.
GrafitoDB 並不試圖成為一個視覺化框架。它只是移除了使用那些優秀工具時令人煩躁的部分。
If you’re working with knowledge graphs in Python and visualization has been a recurring source of friction, this is worth trying. The gap between “I have this graph” and “this is what it actually looks like” becomes small enough that you might start doing it more often.
如果你正在 Python 中處理知識圖譜,而視覺化一直是反覆出現的摩擦來源,那麼這值得一試。「我有這張圖」與「它實際看起來是這樣」之間的差距會變得夠小,小到你可能會開始更常去做這件事。
And once you start seeing your graphs clearly, you usually discover things you wouldn’t have noticed from the raw data or queries alone.
而一旦你開始能清楚地看見你的圖譜,你通常會發現一些光靠原始資料或查詢無法察覺的東西。
— -
— -
Want to go deeper? Every backend covered here has more knobs than this article touches — custom layouts, label functions, color palettes, edge styling, and more. The official visualization documentation walks through all the options with examples.
想要深入了解嗎?本文涵蓋的每一個後端,可調整的細項都比本文觸及的還要多——自訂佈局、標籤函式、調色盤、邊線樣式等等。官方視覺化文件會搭配範例逐一講解所有選項。
🔤 關鍵術語
| 英文 | 繁中譯名 | 文章中的脈絡 / 簡短說明 |
|---|---|---|
| Knowledge Graph | 知識圖譜 | 全文核心主題,由節點與關係構成、用於表達實體間關聯的資料結構 |
| GrafitoDB | GrafitoDB(圖資料庫) | 文章主角,提供知識圖譜的儲存與視覺化橋接工具 |
| force-directed layout | 力導向佈局 | 常見的圖佈局演算法,但密集圖容易產生「毛球」(hairball)難以閱讀 |
| NetworkX | NetworkX | Python 標準圖處理函式庫,GrafitoDB 匯出的中介格式 |
| Cypher | Cypher(查詢語言) | 圖資料庫查詢語言,文中以 MATCH ... RETURN 範例示範 |
| node | 節點 | 圖中代表實體(如 Person、Topic)的元素 |
| relationship / edge | 關係 / 邊 | 連接節點的有向關聯(如 RESEARCHES、USES) |
| PyVis | PyVis | 產生瀏覽器互動式 HTML 視覺化的整合後端 |
| Cytoscape.js | Cytoscape.js | 適合階層或密集圖的專業佈局視覺化函式庫 |
| Netgraph | Netgraph | 產出出版品質靜態圖(PNG/SVG/PDF)的視覺化後端 |
| cose layout (compound spring embedder) | cose 佈局(複合彈簧嵌入器) | Cytoscape 的佈局演算法,密集知識圖譜可讀性優於純力導向 |
| physics simulation | 物理模擬 | PyVis 互動圖中讓節點可拖曳、自動排布的機制 |
| physics preset (spread / compact) | 物理預設模式(分散 / 緊湊) | 控制節點疏密的參數,topic 分離用 spread、密集叢集用 compact |
| edge layout (curved / spline) | 邊佈局(曲線 / 樣條曲線) | 將連線繞過節點、避免直線穿過無關圓圈的繞線方式 |
| color_by_label | 依標籤上色 | 讓不同節點型別(Person/Topic)以顏色區分的選項 |
| D3.js | D3.js | 輸出自包含 HTML 的視覺化後端,亦為常見前端視覺化函式庫 |
| Graphviz | Graphviz | 以 DOT 檔渲染圖形的後端 |
| Mermaid | Mermaid | 可直接在 Markdown 檢視器(GitHub 等)渲染圖表的後端 |
| Matplotlib | Matplotlib | Python 經典繪圖函式庫,可作全控制視覺化後端 |
| SVG (vector output) | SVG(向量輸出) | 任意縮放皆清晰的向量格式,適合文章與論文用圖 |